
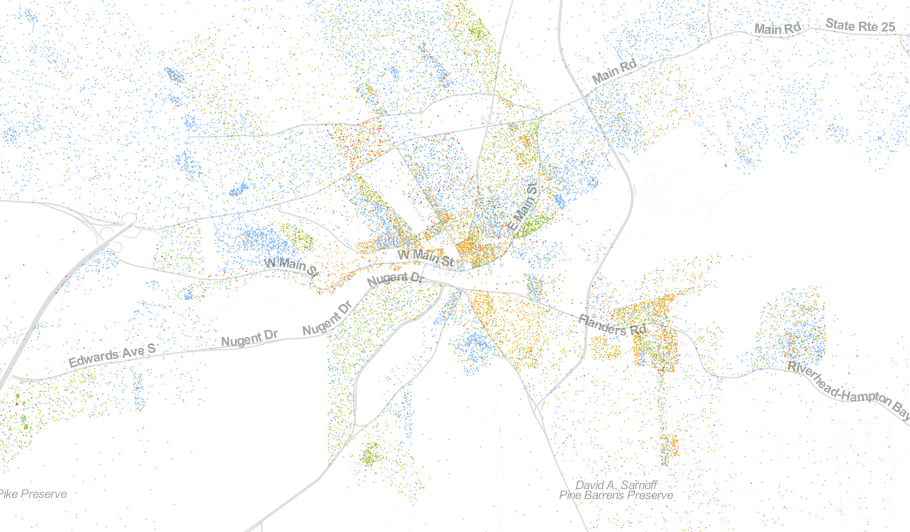
This ‘Racial Dot Map’ shows the diversity of Riverhead
Is Riverhead segregated?
An interactive map based on U.S. Census data can help answer that question.
The map, created by the Weldon Cooper Center for Public Service at the University of Virginia, uses information about the races of people counted in the 2010 Census, marking a dot for each person. The color-coded map shows where people of certain races tend to live within Riverhead’s borders.
The map — which was created to visualize the demographic information — can also be toggled to show population density.
While not as clean divided as cities like Washington D.C. or Charlotteville, Va., the map shows how pockets of people have grouped together in Riverhead. Osborn Avenue is a seemingly clean divide between the predominantly black and Hispanic residents near Riverhead High School and the older residents of Polish Town.
Mill Road also cleaves the population, with Glennwood Village almost entirely white on the western side.
Meanwhile, western Flanders and Riverside residents tend to be black or Hispanic, while the area around Longneck Boulevard is more white.
For a full view of where people are living in Riverhead, click here.
Photo Credit: Weldon Cooper Center for Public Service, Rector and Visitors of the University of Virginia)


